DLG or Digital Line Graphs are digital vector representations of cartographic information derived from USGS maps and related sources. DLG images are used in GIS applications. The above shown image is of Beaufort, SC.
DRG or Digital Raster Graphics are topographic maps from the United States Geological Survey (USGS) that are scanned into computers and used in GIS applications. The DRG image attached is of the western Washington D.C.
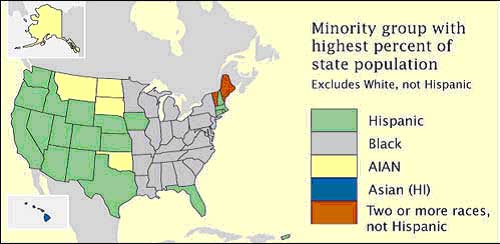
A nominal area chloropleth map is a chloropleth map where the variables are not ordinal data, but merely nominal. In the above chloropleth map largest minority group representation is shown based on color for each state.
A bilateral graph is a graph that displays two variables on the same graph. Usually the two variables have some common relation. The attached graph from the ministry of commerce and Industry of the Government of India shows the import and export numbers in US dollars and also the total trade in US dollars. Since there are three numbers available on this chart it is technically a multilateral graph.
A lorenz curve is a cumulative distribution curve along a possible distribution. Generally a Lorenz curve is used to show income disparity but can be used elsewhere as well. The image above is from the United Nations Development Program of Georgia and shows income distribution across several different years. The closer the curve gets to the diagnal curve line the more evenly distributed the variable is. In this representation one can see that since 1996 income distribution has balanced out greatly.
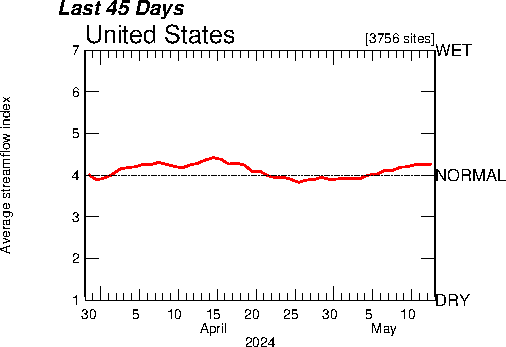
An index value plot is a plot field based around an index value that is determined. The image above from the USGS website shows the streamflow index in the United States over the last 45 days. 1 is considered dry, 7 considered very wet, and 4 is the average index value
A scatterplot is a graph that uses vertical and horizontal coordinates to plot bivariable information. The information above represents max heart rate under stress and age. The information focuses around the age of 55 with a heartrate of 150.