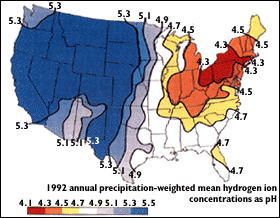
An isoplat map is a isoline map that uses contour lines to show variable changes of acidity in precipitation. This is an indicator of air pollution. The image above shows levels of acidity in the United States and was found on the United States Geology Society Website at http://pubs.usgs.gov/gip/acidrain/gifs/fig04.gif
Sunday, August 3, 2008
Isobars
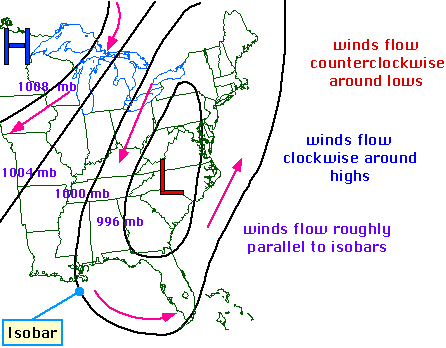
A line drawn on a weather map connecting points of equal pressure is called an isobar. The isobars are generated from mean sea level pressure reports and the pressure values are given in millibars. The image above of the Eastern united states was borrowed from the University of Illinois at Urbana's Website.
Isotach Map
LIDAR
Doppler Radar
Black and white aerial photo
Infrared Aerial Photo
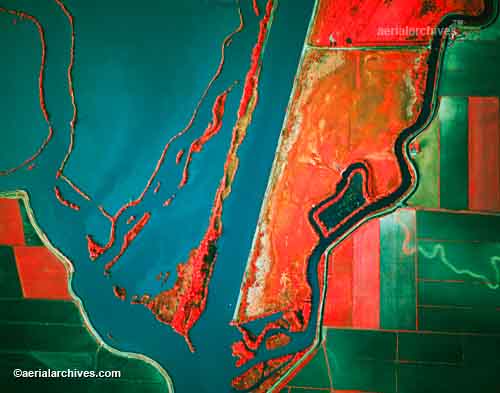
Infrared aerial photos are used to show an image on infrared film. This then provides a record of point to point variations in the temperature of the photograph. Not only can it be used to to show the changes that have taken place in our environments, but it can also be used to monitor such items as damage to roofs, the tracking of dairy farm out flows, pinpointing the source of, and monitoring, insect or disease infested vineyards, or sites contaminated by toxic chemicals, and many more applications.
The above image is an Infrared areial photo of the Middle Mississippi River taken in 1994.
Subscribe to:
Posts (Atom)